Master
Data Analytics Courses in Delhi with Placement
India’s Only Data Science Training Program created to help you to build a successful career in Data Science from scratch.
Top 12 Data Analytics Courses in Delhi with Placement
Welcome to our list of top 12 Data Analytics Courses in Delhi with Placement.
Delhi, widely regarded as the heart of India, besides being its capital and seat of power, is a mega urban agglomeration that sits astride river Yamuna. A city of profound historical significance, with numerous historical monuments dotting its landscape, Delhi is also an important commercial, transport and cultural hub known for its wide straight avenues lined by trees on either side and contemporary office spaces and shopping centres housing some of the biggest brands and global corporations, Delhi is a microcosm of Modern India.
Delhi offers a thriving business environment apart from serving as a hub for exceptional education. As the need for proficient data analysts grows across sectors like Finance, IT , healthcare, E-commerce, Delhi has become an ideal destination for those seeking lucrative job prospects. There is a wide range of Data Analytics Courses in Delhi.
Comparison Chart: Top 12 Data Analytics Courses in Delhi with Placement
If you are looking for the best and most reliable information regarding Data Analytics Courses in Delhi with Placement, then you have come to the right place.
| Institute | Name | Training Delivery Type | Offering Course Since | Fees | Placement |
| 1 | DigiPerform | Online and Offline | 2014 | INR 30k-90k | 100%* |
| 2 | Skill Circle | Online | 2016 | NA | 100% |
| 3 | Great Learning | Online and Offline | NA | 97000+GST | 3000+ learners placed |
| 4 | Imarticus Learning | Online and Offline | 2012 | 198,000 | NA |
| 5 | IIM Skills | Online and Offline | 2015 | 49900+ Taxes | 100% |
| 6 | Excel R | Online | 2021 | 75,999 | NA |
| 7 | Analytixlabs | Online | 2011 | 139900+GST | 100% |
| 8 | Jee Tech Academy | Online and Offline | 2009 | Affordable Fees | 100+Placement Partners |
| 9 | Madrid Software Training | Online and Offline | 2011 | 25,000 | Dedicated placement coordinator assigned to every candidate |
| 10 | IMS Pro school | Online | 2000 | 60,000 | NA |
| 11 | Simplilearn | Online | 2010 | 54000 | 100% |
| 12 | Google Data Analytics Professional Certificate-Coursera | Online | NA | 1108 per month | 100% |
What is Data Analytics?
A data analyst is a professional who specializes in collecting, processing, and performing statistical analysis on large data sets. They play a critical role in inspecting, cleansing, transforming, and modeling data to uncover valuable insights, draw conclusions, and support decision-making.
Key Responsibilities of a Data Analyst:
- Data Collection: Identifying and gathering relevant data from various sources.
- Data Cleaning: Inspecting and processing raw data to ensure accuracy and completeness.
- Data Enrichment: Combining data from multiple sources to enhance its value.
- Statistical Analysis: Using statistical techniques and analytics tools to analyze large data sets.
- Interpretation: Interpreting analysis results to identify trends and inform business decisions.
- Reporting: Presenting key findings through visualizations such as dashboards and graphs.
Data analysts are essential in industries like finance, e-commerce, healthcare, and retail. Their expertise in statistical modeling and data analytics helps organizations derive actionable insights from data.
Types of Data Analytics
There are 4 main types of data analysts based on their expertise and job roles:
1. Business Analysts
Role: Business analysts leverage data to address business challenges. They collaborate with stakeholders to gather and analyze data, aiming to enhance business processes, identify opportunities, and support decision-making.
Skills: Strong business acumen, data visualization, requirements gathering, and the ability to bridge the gap between technical and non-technical teams.
2. Financial Analysts
Role: Financial analysts utilize data to provide insights into financial performance, assess risks, and identify investment opportunities. They typically work in banking, finance, and investment sectors.
Skills: Financial modeling, forecasting, proficiency in financial software, and an understanding of financial regulations.
3. Data Scientists
Role: Data scientists are experts who apply advanced statistical and machine learning techniques to extract insights and build predictive models from complex datasets. They handle unstructured data and solve intricate data problems.
Skills: Programming (Python, R), machine learning, deep learning, big data technologies, and domain-specific expertise.
4. Healthcare Data Analysts
Role: Healthcare data analysts focus on analyzing patient data, medical records, and healthcare trends to improve patient care, reduce costs, and ensure compliance with healthcare regulations.
Skills: Knowledge of healthcare data standards, electronic health records (EHR) systems, and healthcare analytics tools.
Benefits of Data Analytics
Unlocking various insights
This involves revealing patterns, various trends and correlations in data and also informing about business related correlations.
Optimizing Operations
Identifying areas and scope for improvement, streamlining most of the processes and also enhancing your efficiency.
Driving innovation
To uncover new opportunities, enabling companies to stay in competition and stay innovative.
Improving Customer Experience
Analyzing customer behaviors, their preferences and needs. This also involves enabling personalized engagement in order to provide best customer experiences.
Mitigates Risks
Identifying potential risks and threats, also allowing proactive measures to be taken in order to minimize the fallout.
Facilitates informed decision-making
Providing data-driven insights, reducing dependance on intuition, gut feel and bias.
Boosting Revenue
Identifying opportunities to increase revenue, optimizing pricing and improving resource allocation.
Aids strategic planning
Informing long term strategies, helping organizations in achieving their goals and objectives.
Strengthening Collaboration
Promotes a data driven culture by facilitating data-sharing and insights across various departments.
Being Competitive
In the current data-based landscape, companies that adopt data analytics have an advantage over others in terms of competition.
Top 12 Data Analytics Courses in Delhi
1. Digiperform
After doing the Digi perform online Data Analytics course, you can apply for the Data Analysts post. And to get your dream job Digi perform’s dedicated placement cell will help you with 100%* placement assistance.
Why Choose Digiperform Online Data Science Course?
The big question that comes to our mind is that there are a number of Data Analytics courses in Delhi, so why choose Digi Perform?
DIGIPERFORM will help you make a career in the Data Analytics field, with online data analytics course (Master Certification Program in Analytics, Machine Learning, and AI). India’s Only Online Data Science and Analytics Training Program.
Digi perform stands out as the largest training provider in India, specializing in digital skills. Our courses are meticulously curated and regularly updated by a team comprising more than 50 experts in the realm of digital marketing. To ensure comprehensive content, we incorporate insights and suggestions from 450 seasoned professionals representing companies throughout Asia.
We provide the premier Data Analytics Training Program in India, crafted to launch your career in data analytics. Engage in 75+ projects and assignments spanning Statistics, Advanced Excel, SQL, Python Libraries, Tableau, Advanced Machine Learning, and Deep Learning.
These assignments mirror practical data challenges in sectors such as healthcare, manufacturing, sales, media, marketing, and education. Our training you for more than 30 diverse job roles. Digi Perform is regarded as one of the best choices for Data Analytics Courses in Delhi.
Types of jobs in Data Analytics
Data Analytst –
A data analyst is a person who is responsible for collecting, interpreting and analyzing data in order to drive business decisions.
Data Scientist-
The job of a data scientist involves using statistical techniques and machine learning algorithms in order to uncover various insights and develop predictive models.
Business Intelligence Developer-
A business intelligence developer indulges in creating data visualizations and reports which in turn help organizations to make better business-related decisions.
Data Engineer-
A data engineer is a person who designs and builds the entire infrastructure in order to process, store and retrieve large datasets.
Quantitative Analyst-
This job involves using mathematical models in order to analyze and also optimize business processes.
Data Architect-
A Data Architect has to develop an architecture for managing data and governance.
Statistician-
A Statistician has to collect and analyze data in order to understand patterns and trends.
Machine Learning Engineer-
This job involves developing predictive models and algorithms which in turn would help in solving problems that are complex in nature.
Data Science Course Syllabus
Module 1: Introduction to Data Science | Introduction to the Industry & Buzzwords Industrial application of data science Introduction to different Data Science Techniques Important Software & Tools Career paths & growth in data science |
Module 2: Introduction to Excel
| Introduction to Excel- Interface, Sorting & Filtering,
Excel Reporting- Basic & Conditional Formatting
Essential Excel Formulae
Layouts, Printing and Securing Files |
Module 3: Introduction to Stats
| Introduction to Statistics & It’s Applications Different types of Data Population vs Sample Sampling Techniques Intro: Inferential vs. descriptive statistics |
Module 4: Descriptive Stats Using Excel Datasets | Categorical Variables Visualization Using Excel Charts- FDT, Pie Charts, Bar Charts & Pareto Numerical Variables Visualization of Frequency & Absolute Frequency- Using Histogram, Cross Table & Scatter Plot Measure of Spread ( Mean, Mode , Median) Measure of Variance( Skewness, SD, Variance, Range, Coef. Of Variance, Bivariate Analysis, Covariance & Correlation) |
Module 5: Inferential Stats Using Excel Datasets | Introduction to Probability Permutation & Combinations Types of events Normal distribution Standard Normal distribution Normal vs. Standard Normal distribution Confidence Intervals & Z-Score Hypothesis Testing & It’s Types |
Module 6: Database Design & MySQL | Relational Database theory & Introduction to SQL MySQL Installation Database Creation in the MySQL Workbench Querying in MySQL Joins and Set Operations SQL Practice Case Study Window Functions Case Statements, Stored Routines and Cursors Ø Query Optimisation and Best Practices Ø Problem-Solving Using SQL |
Module 7: Data Visualization Using Advanced Excel
| Introduction LOOKUP functions Pivot Tables WHATIF Analysis Dashboard Creation Recording Macros Advanced Visualizations- PIVOT Charts, Sparklines, Waterfall Charts Data Analysis ToolPak – Regression in Excel |
Module 8: Data Visualization Using Tableau | Introduction to Tableau Introduction What is Data Analytics? Why Data Visualisation? What is Tableau? Why Tableau? Tableau vs Excel and PowerBI Exploratory and Explanatory Analysis Getting started with Tableau Visualizing and Analyzing data with Tableau – I Introduction Bar Charts Line Charts and Filters Area Charts Box plots and Pivoting Maps and Hierarchies Pie Charts Treemaps and Grouping Dashboards Visualizing and Analyzing Data with Tableau – II Introduction Joins and Splits Numeric and String functions Logical and Date functions Histograms and parameters Scatter Plots Dual Axis Charts Top N Parameters and Calculated Fields Stacked bar Charts Dashboards – II and Filter Actions Storytelling Summary |
Module 9: Python Programming
| Installing Anaconda & Basics of Python Introduction to programming languages Compiler vs Interpreter Getting Started With Python Introduction to jupyter Notebooks Identifiers, Keywords Print function Comment, Indentation Data Types Functions Understanding what are functions Defining and calling functions Local and global variables Different types of arguments Map,reduce,filter,lambda and recursive functions Data Structures in Python Introduction Lists Tuples Sets Dictionaries Practice Exercise Summary Operator Input and Output Different Arithmetic , logical and Relational operators Input, Output function Eval function Format Function Control Flow If elif else statement For and while loops Break , continue and Pass statement List and dictionary comprehensions Functions Understanding what are functions Defining and calling functions Local and global variables Different types of arguments Map,reduce,filter,lambda and recursive functions File Handling Purpose of file handling Different function in file handling (open,read, write,close) Different modes (r,w,a,r+,w+,a+) With block Exception Handling, OOPX & Regex What is exception handling Try, except, else and finally block Different types of Exception Concept of Oops Different functions in Regex Metacharacters in Regex |
Module 10: Python For Data Science | NumPy Introduction to NumPy Basics of NumPy Operations Over 1-D Arrays Practice Exercise I Multidimensional Arrays Creating NumPy Arrays Mathematical Operations on NumPy Mathematical Operations on NumPy II Computation Times in NumPy vs Python Lists Practice Exercise II Pandas Introduction to Pandas Basics of Pandas Pandas – Rows and Columns Describing Data Indexing and Slicing Operations on Dataframes Groupby and Aggregate Functions Merging DataFrames Pivot Tables Practice Exercise |
Module 11: Data Visualization Using Python- Matplotlib & Seaborn
| Introduction to Data Visualisation with Matplotlib Introduction to Matplotlib The Necessity of Data Visualisation Visualisations – Some Examples Facts and Dimensions Bar Graph Scatter Plot Line Graph and Histogram Subplots Choosing Plot Types Summary Data Visualisation: Case Study Introduction Case Study: Mind Map Case Study Overview Data Handling and Cleaning: I Data Handling and Cleaning: II Sanity Checks Outliers Analysis with Boxplots Histograms Summary Practice Questions Data Visualization with Seaborn Introduction Distribution Plots Styling Options Pie – Chart and Bar Chart Scatter Plots Pair Plots Revisiting Bar Graphs and Box Plots Heatmaps Line Charts Stacked Bar Charts Case Study Summary Plotly Practice Questions |
Module 12: Exploratory Data Analysis | Data Sourcing Module Introduction Introduction to EDA Public and Private Data Private Data Public Data Web Scraping-I Web Scraping-II Summary Data Cleaning Introduction Data Types Fixing the Rows and Columns Impute/Remove Missing Values Handling Outliers Standardising Values Fixing Invalid Values and Filter Data Practice Questions Summary Univariate Analysis Introduction to Univariate Analysis Categorical Unordered Univariate Analysis Categorical Ordered Univariate Analysis Statistics on Numerical Features Graded Questions Summary Bivariate and Multivariate Analysis Introduction Numeric – Numeric Analysis Correlation vs Causation Numerical – Categorical Analysis Categorical – Categorical Analysis Multivariate Analysis Graded Questions Summary Module Summary |
Module 13: Supervised Learning Model - Regression | Introduction to Simple Linear Regression Introduction to Simple Linear Regression Introduction to machine learning Regression line Best fit line Strength of simple linear regression Simple linear regression in python Assumptions of simple linear regression Reading and understanding the data Hypothesis testing in linear regression Building a linear model Residue analysis and predictions Linear Regression using SKLearn Multiple Linear Regression Motivation-when one variable is not enough Moving from SLR to MLR-new considerations Multi collinearity Dealing with categorical variables Model assessment in comparison Feature selection Multiple Linear Regression in Python Reading and understanding the data Data preparation Initial steps Building the model I & II Residue analysis and predictions Variable selection using RFE Industry Relevance of Linear Regression Linear regression revision Prediction versus projection Media company case study Exploratory data analysis Model building - I, II & III Assessing the model Interpreting the results |
Module 14: Supervised Learning Model - Classification | Univariate Logistic Regression Binary classification Sigmoid curve Finding the best fit sigmoid curve - I Finding the best fit sigmoid curve - II Odds and log Odds Multivariate Logistic Regression - Model Building Multivariate Logistic Regression - Model Building Data cleaning and preparation - I & II Building your first model Feature elimination using RFE Confusion metrics and accuracy Manual feature elimination Multivariate Logistic Regression - Model Evaluation Multivariate Logistic Regression - Model Evaluation Metrics beyond accuracy-sensitivity and specificity Sensitivity and specificity in Python Understanding ROC curve ROC curve in python Finding the optimal threshold Model evaluation metrics - exercise Precision and recall Making predictions Logistic Regression - Industry Applications - Part I Getting familiar with logistic regression Nuances of logistic regression-sample selection Nuances of logistic regression-segmentation Nuances of logistic impression-variable transformation-I, II & III Logistic Regression: Industry Applications - Part II Model evaluation - A second look Model validation and importance of stability Tracking of model performance over time Logistic Regression - Industry Applications - Part II Commonly face challenges in implementation of logistic regression Model evaluation - A second look Model validation and importance of stability Tracking of model performance over time |
Module 15: Advanced Machine Learning | Unsupervised Learning: Clustering Introduction to Clustering K Means Clustering Executing K Means in Python Hierarchical Clustering Business Problem Solving Introduction to Business Problem Solving Case Study Demonstrationchurn example Practice Questions Tree Models Introduction to Decision Trees Algorithms for Decision Tree Construction Hyperparameter Tuning in Decision Trees Ensembles and Random Forests Time Series Forecasting - I (BA) Introduction to Time Series Smoothing Techniques Time Series Forecasting - II (BA) Introduction to AR Models Building AR Models Model Selection Principles of Model Selection Model Building and Evaluation |
Module 16: AI- NLP, Neural Networks & Deep Learning | Introduction to NLP What is NLP? History and evolution of NLP Applications of NLP Challenges in NLP Overview of NLP pipeline Corpus and Corpus Linguistics NLTK Toolkit Introduction to the NLTK toolkit Preprocessing text data with NLTK Basic NLP tasks using NLTK (e.g., Part-ofSpeech Tagging, Named Entity Recognition) Stemming and Lemmatization WordNet in NLTK Chunking and Chinking Sentiment Analysis with NLTK Tokenization and Topic Modeling Tokenization in NLP Bag-of-Words representation Topic Modeling with LDA Latent Semantic Analysis Word Embeddings Sentiment Analysis Project: Introduction to Sentiment Analysis Sentiment Analysis using supervised and unsupervised methods Building a Sentiment Analysis model with Python Evaluating Sentiment Analysis models AI vs Deep Learning vs ML Introduction to Artificial Intelligence (AI), Machine Learning (ML) and Deep Learning (DL) Applications of AI, ML, and DL Differences between AI, ML and DL The Concept of Neural Networks Introduction to Neural Networks Types of Neural Networks Layers in Neural Networks Activation Functions Neural Networks - Feed-forward, Convolutional, Recurrent Feed-forward Neural Networks Convolutional Neural Networks Recurrent Neural Networks Applications of Neural Networks Deep Learning Project Building a Deep Learning model with Python Image Classification with Convolutional Neural Networks Natural Language Processing with Recurrent Neural Networks |
Data Science Projects and Assignments
Major Projects
Customer Lifetime Value Calculation: The project involves calculating the customer lifetime value using SQL to understand the revenue generated by a customer over their lifetime.
Customer Churn Prediction: This project involves building a predictive model using SQL to identify customers who are likely to churn based on their behavior and transaction history.
Interactive Dashboard for E-Commerce Sales: The project involves creating an interactive dashboard using Tableau & SQL to analyze retail sales data, identify trends, and make data-driven decisions.
Customer Segmentation Dashboard: This project involves creating a customer segmentation dashboard using Tableau to identify customer groups based on demographics, behavior, and purchasing patterns.
Movie Recommendation System: The project involves building a movie recommendation system using Python and its libraries such as Pandas, NumPy, and Scikit-Learn. The recommendation system will suggest movies based on user preferences and ratings.
Sentiment Analysis on Twitter Data: This project involves analyzing Twitter data using Python and its libraries such as NLTK and TextBlob to perform sentiment analysis and understand the overall sentiment of a particular topic.
Visualizing COVID-19 Data: The project involves visualizing COVID-19 data using Python and its libraries such as Matplotlib, Seaborn, and Plotly to understand the impact of the pandemic on different countries and regions.
Visualizing Stock Market Data: This project involves visualizing stock market data using Python and its libraries such as Pandas, Matplotlib, and Bokeh to understand the trends and patterns in stock prices over time.
Airbnb Data Analysis: The project involves performing exploratory data analysis on Airbnb data to understand the patterns in the pricing, availability, and quality of Airbnb listings in different cities.
Bike Sharing Data Analysis: This project involves performing exploratory data analysis on bike sharing data to understand the usage patterns of bikes in different cities and identify factors that influence bike usage.
House Price Prediction: The project involves building a regression model using Python and its libraries such as Scikit-Learn to predict the prices of houses based on their features such as location, size, and amenities.
Credit Risk Prediction: This project involves building a classification model using Python and its libraries such as Scikit-Learn to predict the credit risk of loan applicants based on their credit history and other factors.
Time Series Forecasting for Sales Data: The project involves building a time series forecasting model using advanced machine learning algorithms such as ARIMA and LSTM to predict future sales trends and identify factors that influence sales.
Sentiment Analysis on Product Reviews: The project involves building a sentiment analysis model using NLP techniques such as Word Embeddings and Recurrent Neural Networks (RNN) to analyze product reviews and understand the sentiment of customers towards different products.
Segmentation using Deep Learning: This project involves using advanced deep learning techniques such as Fully Convolutional Networks (FCN) and U-Net to perform image segmentation and identify objects in images.
Machine Translation using Transformers: This project involves building a machine translation model using advanced deep learning techniques such as Transformers to translate text from one language to another.
Case Studies & Assignments:
- Healthcare Customer Feedback Analysis
- Management Teams Dashboard Creation
- Retail Store Sales Report Analysis
- Software Firm Employee Data Analysis
- Industrial Data Sets Classification & Comparison
- Charts & Graphs: Frequency Distribution Table, Pie-charts, Pareto Diagram, Histogram, Scatter Plots, Heatmaps, Bar Graphs and many More.
- Patient Disease Probability Analysis Using Healthcare Data
- Car Model & Menu Item Data Combination & Configuration Probability Analysis
- Manufacturing & Product Launch Data Classification & Analysis
- Customer Complaint Resolution Analysis Using Normal Distribution Curves
- Product Rating & Employee Productivity Analysis Usign Z-Score
- New Product Need Analysis Using Hypothesis Testing
- Inventory Management & Customer Segmentation Systems Using Vlook up & Hlook Lookup
- Sales Trend & Staffing Plan Creation using Pivot Tables
- Pricing Strategy & Financial Model Creation Using What if Analysis
- Sales & Operations Dashboard Creation
- Healthcare & Construction Reporting Automation Using Macros
- Retail Sales Opportunity Analysis Using PIVOT Charts
- Accounting Firm Statement Analysis Using Sparklines & Waterfall Chart
- FMCG Marketing Spend to Sales Revenue Impact Analysis Using Regression Analysis
- Transportation Pricing Model Using Regression Analysis
Data Analytics Placements
100% * Placement Assistance Dedicated Placement Cell To Help You Land Your Dream Job
Data science course fees
Program in Data Analytics Fees: 30k-90k
Contact Information
Digiperform Corporate Office: C-30, Third Floor, Sector-2, Near Sec-15 Metro Station, Noida, Uttar Pradesh 201301, India
Email: contact@digiperform.com
Phone: +91-8527-611-500
Website: www.digiperform.com
2. Skill Circle
Skill Circle covers fundamental and basic principles such as data collection and data exploration. By using tools like Python and SQL , you will gain proficiency in data manipulation and analysis.
Plus, you will gain knowledge about transforming raw data into compelling, engaging and visually appealing narratives. With Power BI, creating interactive dashboards that convey insights effectively. Skill Circle is a good choice for Data Analytics courses in Delhi.
By choosing Skill Circle , you will benefit from expert instructors offering practical and real-world applications.
| Name | DATA SCIENCE / AI |
| Course Duration | 6 Months |
| Website | https://skillcircle.net/data-science-course/ |
| Address: | N/A |
| Avg. Google Rating: | 4.8/10 |
| Offering – Since: | 2016 |
| Fees | NA |
| Branches in India: | 15 |
| Exclusive Data Science Institute: | NO |
| Flagship Course Names: | NA |
| Training Delivery Model | Online & Offline |
3. IIM Skills
IIM Skills is one of the most prominent places to learn and gain in-demand skills. This institute has been recognized by the government and is amongst the best choices for data analytics courses in Delhi. They have a comprehensive course, which is a full package of practical learning and knowledge with hands-on assignments that play a major role in developing students along with their portfolios which in turn help in getting into industry with ease.
| Name | DATA SCIENCE / AI |
| Course Duration | 6 Months |
| Website | https://iimskills.com/data-analytics-courses-in-delhi/ |
| Address: | 308, 3rd Floor, Max Hospital Building, Netaji Subhash place, Pitam Pura, New Delhi, Delhi-110034. |
| Avg. Google Rating: | 4.5/5 |
| Offering – Since: | 2015 |
| Fees | INR 49900+ taxes |
| Branches in India: | 21 |
| Exclusive Data Science Institute: | NO |
| Flagship Course Names: | NA |
| Training Delivery Model | Online & Offline |
4. Great Learning
Great learning is one of India’s most successful Data Analytics Bootcamp taught by an award-winning expert faculty. The course is designed for beginners and freshers to gain skills in Python, SQL, Pandas and Numpy.
| Name | DATA SCIENCE / AI |
| Course Duration | 11 Months |
| Website | https://www.mygreatlearning.com/pg-program-data-science-and-business-analytics-course-in-delhi-ncr |
| Address: | NA |
| Avg. Google Rating: | 4.8/5 |
| Offering -Since: | NA |
| Fees | INR 97000 |
| Branches in India: | NA |
| Exclusive Data Science Institute: | NO |
| Flagship Course Names: | NA |
| Training Delivery Model | Online & Offline |
5. Imarticus Learning
Headquartered in Delhi, the institute is well-established and known for having specialization and expertise in the fields such as Data Analytics, Data Science and Finance. It is considered as a good choice for data analytics courses in Delhi.
| Name | DATA SCIENCE / AI |
| Course Duration | 6 Months |
| Website | https://imarticus.org/delhi/ |
| Address: | Imarticus Learning Private Limited, H- 16, Block H , Indra Palace, Ground Floor , Middle Circle, Connaught Place, New Delhi – 110001. |
| Avg. Google Rating: | 9/10 |
| Offering Since: | 2012 |
| Fees | INR 198000 |
| Branches in India: | 21 |
| Exclusive Data Science Institute: | NO |
| Flagship Course Names: | NA |
| Training Delivery Model | Online & Offline |
6. Excel R
Excel R is an institute known for providing one of the best data analytics courses in Delhi. With a wide spectrum of over 40 nations, the institute has a great and efficient management. The institute has been providing a number of courses in data science and data analytics and has been well adopted in the field for 10 years. The course structure of Excel R has been designed keeping in mind the emerging needs of the industry.
| Name | DATA SCIENCE / AI |
| Course Duration | 6 Months |
| Website | https://www.excelr.com/data-science-coursetraining-in-delhi/ |
| Address: | NA |
| Avg. Google Rating: | 4.9/5 |
| Offering Since: | 2021 |
| Fees | INR 75999 |
| Branches in India: | NA |
| Exclusive Data Science Institute: | NO |
| Flagship Course Names: | NA |
| Training Delivery Model | Online |
7. Analytixlabs
Analytixlabs has been considered as one of the best training institutes for providing data analytics courses in Delhi. Since 2011, the institute has a wide range of courses in Data Science and has been considered as a trusted training program in Delhi, Gurgaon, Bangalore and Noida. Alongwith a well experienced and an expert faculty, Analytixlabs provides globally credible certifications.
| Name | DATA SCIENCE / AI |
| Course Duration | 5 Months |
| Website | https://www.analytixlabs.co.in/data-analyst-training- course-in-delhi |
| Address: | NA |
| Avg. Google Rating: | 4.9/5 |
| Offering Since: | 2011 |
| Fees | INR 139900 |
| Branches in India: | 4 |
| Exclusive Data Science Institute: | NO |
| Flagship Course Names: | NA |
| Training Delivery Model | Online |
8. Jee Tech Academy
Jee tech is considered to be one of the premium data science agencies providing data analytics courses in Delhi. Jee tech Academy’s best-selling courses are Digital Marketing, Artificial Intelligence, Data Science Course and ethical hacking. Since 2009, the institute has been regarded as a highly trusted training provider with having trained more than 33500 alumini provider with having trained more than 33500 alumini.
| Name | DATA SCIENCE / AI |
| Course Duration | 5 Months |
| Website | https://jeetechacademy.com/data-analytics-course/ |
| Address: | A-1/105, 1st Floor, Sector-06, Rohini, Delhi -110085. |
| Avg. Google Rating: | NA |
| Offering Since: | 2009 |
| Fees | Affordable Fees |
| Branches in India: | NA |
| Exclusive Data Science Institute: | NO |
| Flagship Course Names: | NA |
| Training Delivery Model | Online and Offline |
9. Madrid Software Training
Madrid Software Training is a renowned institute offering one of the best data analytics courses in Delhi. Having trained over 5000 professionals, the institute has been known as the leading training program in big data Hadoop, web development, and digital marketing since 2011.
| Name | DATA SCIENCE / AI |
| Course Duration | NA |
| Website | https://www.madridsoftwaretrainings.com/index |
| Address: | Metro Station, Madrid Software Trainings, Plot No.5, Ground Floor, Lane No.1, Westend Marg, behind Saket, Saidulajab, New Delhi, Delhi 110030 |
| Avg. Google Rating: | 4.8 |
| Offering Since: | 2011 |
| Fees | INR 25000 |
| Branches in India: | NA |
| Exclusive Data Science Institute: | NO |
| Flagship Course Names: | NA |
| Training Delivery Model | Online and Offline |
10. IMS Proschool
IMS pro school is another prestigious institute in the field of data analytics. It is an educational institute well-known for providing many data science courses and PG Diploma Programs. Having trained over 4000 aspirants, the institute has been ranked 4th best Data Science Institute.
| Name | DATA SCIENCE / AI |
| Course Duration | 6 Months |
| Website | https://www.imsindia.com/proschool/business-analytics.html |
| Address: | NA |
| Avg. Google Rating: | 9.4/10 |
| Offering Since: | 2000 |
| Fees | INR 60000 |
| Branches in India: | 11 |
| Exclusive Data Science Institute: | NO |
| Flagship Course Names: | NA |
| Training Delivery Model | Online |
11. Simplilearn
By pursuing this IBM-sponsored, data analytics course, you will gain mastery and expertise in the field of data analytics. Some important aspects like tools and methods, SQL Database Administration, R and Python programming, data visualization and use of statistics are all covered in this course.
| Name | DATA SCIENCE / AI |
| Course Duration | 1 Year |
| Website | https://www.simplilearn.com/pgp-data-analytics-certification-training-course-delhi-city |
| Address: | NA |
| Avg. Google Rating: | 4.4 |
| Offering Since: | 2000 |
| Fees | INR 54000 |
| Branches in India: | 11 |
| Exclusive Data Science Institute: | NO |
| Flagship Course Names: | NA |
| Training Delivery Model | Online |
12. Google Data Analytics Professional Certificate
In this program, with the help of 180+ hours and hundreds of practice-based tests, you will be able to practice all the essential real world data analytics situations for professional success. Since ,this course is highly interactive, it is considered as one of the best data analytics courses in Delhi and the content was created by Google workers with vast and extensive knowledge.
| Name | DATA SCIENCE / AI |
| Course Duration | Less Than 6 Months |
| Website | https://www.coursera.org/professional-certificates/google-data-analytics |
| Address: | NA |
| Avg. Google Rating: | 4.8 |
| Offering Since: | 2000 |
| Fees | INR 1108 after 7-day trial |
| Branches in India: | NA |
| Exclusive Data Science Institute: | NO |
| Flagship Course Names: | NA |
| Training Delivery Model | Online |
Who should learn Data Analytics in Delhi?
Data Analytics is ideal for professionals seeking to advance their careers, recent graduates aiming for competitive job roles, and individuals in sectors like IT, finance, or healthcare wanting to leverage data insights. In Delhi’s growing tech landscape, those interested in making data-driven decisions will find significant opportunities.
Why should you study Data Analytics?
Studying Data Analytics empowers you to transform raw data into actionable insights, driving informed decision-making and strategic growth. It enhances your problem-solving skills and opens doors to diverse career opportunities across industries. With data becoming a critical asset, mastering analytics ensures you stay competitive and impactful in today’s data-driven world.
How to Become a Data Analyst
If you aspire to become a data analyst, here are the key steps:
Step 1: Obtain the Right Educational Background
Start with a solid educational foundation. A bachelor’s degree in one of the following fields is highly beneficial:
– Statistics
– Computer Applications
– Mathematics or Economics
– Computer Science or IT Engineering
These disciplines provide you with the essential knowledge in statistical modeling, programming, and data analysis, which are crucial for a data analyst role.
Step 2: Develop Essential Technical Skills
To stand out as a data analyst, you need to master a range of technical skills. Focus on learning:
– Programming Languages: R, SAS, Python
– Data Visualization Tools: Tableau, Power BI, MATLAB
– Database Management: SQL
– Data Analysis Tools: Excel
Step 3: Gain Practical Experience
Practical experience is key to becoming a proficient data analyst. Seek out opportunities to apply your skills in real-world scenarios:
– Internships: Secure internships during your college years to get hands-on experience.
– Projects: Work on projects that involve data modeling and analysis.
– Freelancing: Take up freelance projects to build a diverse portfolio.
– Volunteering: Offer your skills to research labs and nonprofits to gain additional experience.
Step 4: Consider Advanced Education (Optional)
While not always necessary, a master’s degree can significantly enhance your expertise and career prospects. Consider pursuing:
– MS in Statistics or Data Science
– MBA with a focus on Business Analytics
– Post Graduate Program in Data Analytics and Business Intelligence
Advanced degrees provide in-depth knowledge and often include internship opportunities or capstone projects.
Step 5: Obtain Data Analytics Certifications
Certifications can greatly enhance your resume and demonstrate your commitment to the field. Some valuable certifications include:
– IBM Certified Data Analyst Professional
– Microsoft Certified: Power BI Data Analyst Associate
– Tableau Desktop Certified Associate
– Python for Data Science and Machine Learning Bootcamp
These certifications validate your skills and make you a more competitive candidate.
Step 6: Apply for Data Analytics Positions
With your education, skills, and experience in place, you’re ready to start applying for data analyst roles. Look for positions such as:
– Business Intelligence Analyst
– Data Analytics Associate
– Junior Data Scientist
– Analytics Consultant
Explore job opportunities in various sectors, including IT, finance, e-commerce, and consulting firms.
Step 7: Continuously Update Your Skills
The field of data analytics is constantly evolving. Stay updated with the latest trends, tools, and technologies by:
– Attending Workshops and Webinars
– Participating in Online Courses
– Joining Professional Networks and Forums
– Reading Industry Publications
At Digiperform, we offer comprehensive training programs designed to equip you with the skills and knowledge required to excel in the field of data analytics. Start your journey with us and unlock the potential of data to transform your career.
For more information, visit our website and explore our data analytics courses tailored to meet industry standards.
Career Scope in Data Analytics in Delhi
The career scope in Data Analytics in Delhi is vast and promising, driven by the city’s rapid technological and industrial advancements. Delhi’s diverse sectors, including IT, finance, healthcare, and retail, are increasingly relying on data-driven decisions, creating a high demand for skilled data analysts. Fresh graduates and professionals can find numerous opportunities to work with leading companies, leveraging data to drive business strategies and innovation.
At Digiperform, we recognize the immense potential of Data Analytics in shaping successful careers. Our specialized training programs are designed to equip you with the necessary skills and knowledge to excel in this field. By mastering data analysis, visualization, and interpretation, you can unlock a world of possibilities and secure a rewarding career in one of Delhi’s most dynamic and growing industries. Join Digiperform and embark on your journey to becoming a data analytics expert today.
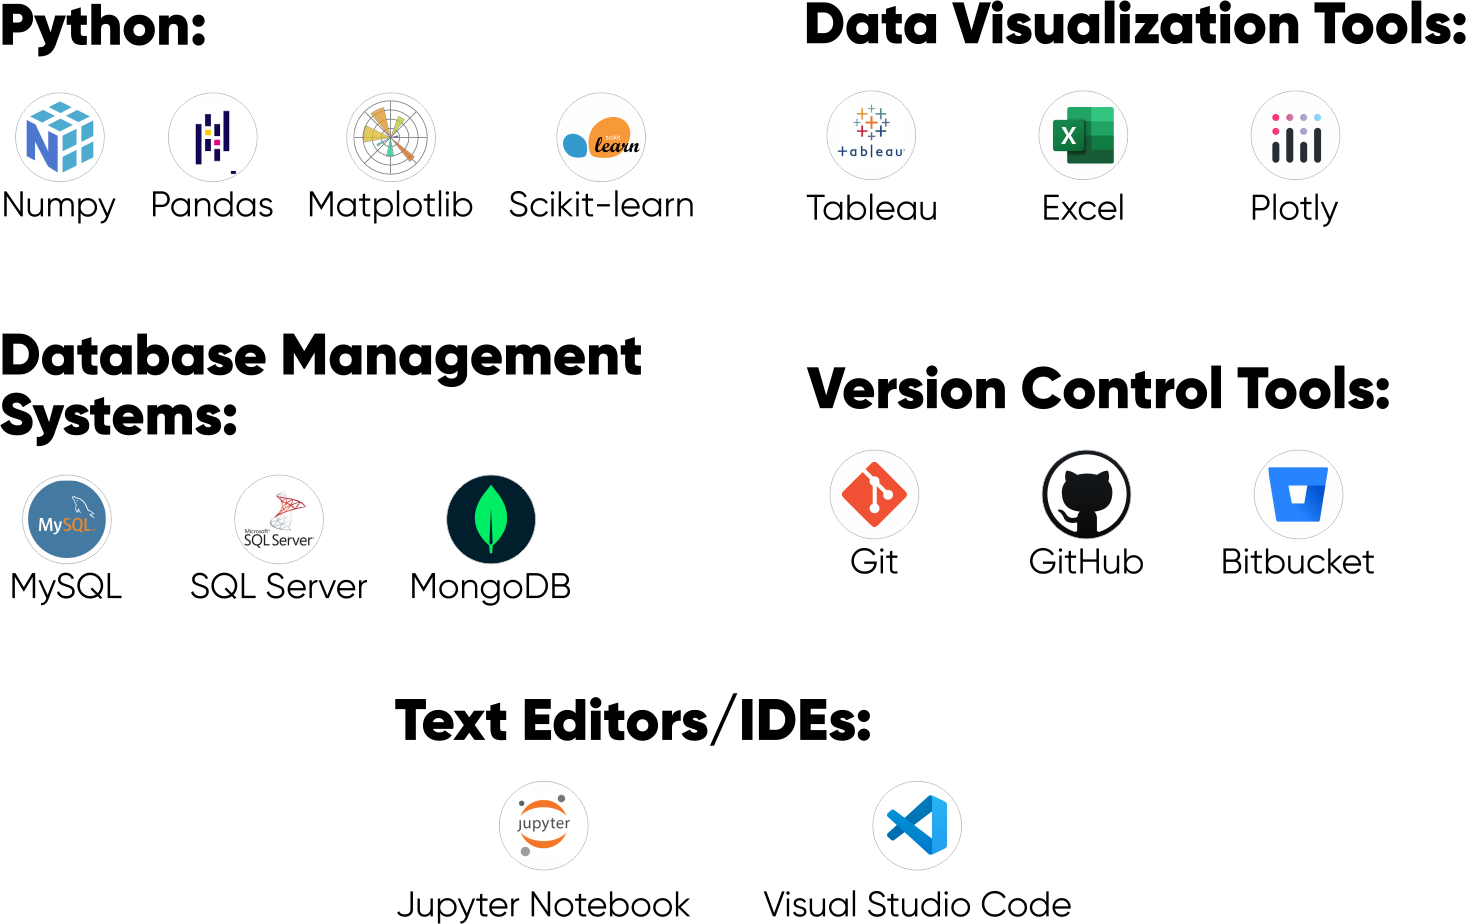
Mastering Data Analytics Tools
Master Data Analytics tools with Digiperform to elevate your career. Our comprehensive training program equips you with essential skills in data analysis, visualization, and interpretation. Stay ahead in the competitive job market and transform raw data into actionable insights. Enroll now and become a data analytics expert.
Data Analytics Salaries for Freshers in Delhi
In Delhi, Data Analytics salaries for freshers are competitive, mirroring the city’s increasing need for skilled professionals in this domain. Entry-level roles, such as Data Analysts or Junior Data Scientists, offer salaries that align with industry norms. With Delhi establishing itself as a center for technological and industrial advancement, fresh graduates in Data Analytics have numerous opportunities. The city’s diverse sectors, including IT, finance, and healthcare, drive the demand for data analytics expertise, making it a promising and financially rewarding career path for newcomers in Delhi.
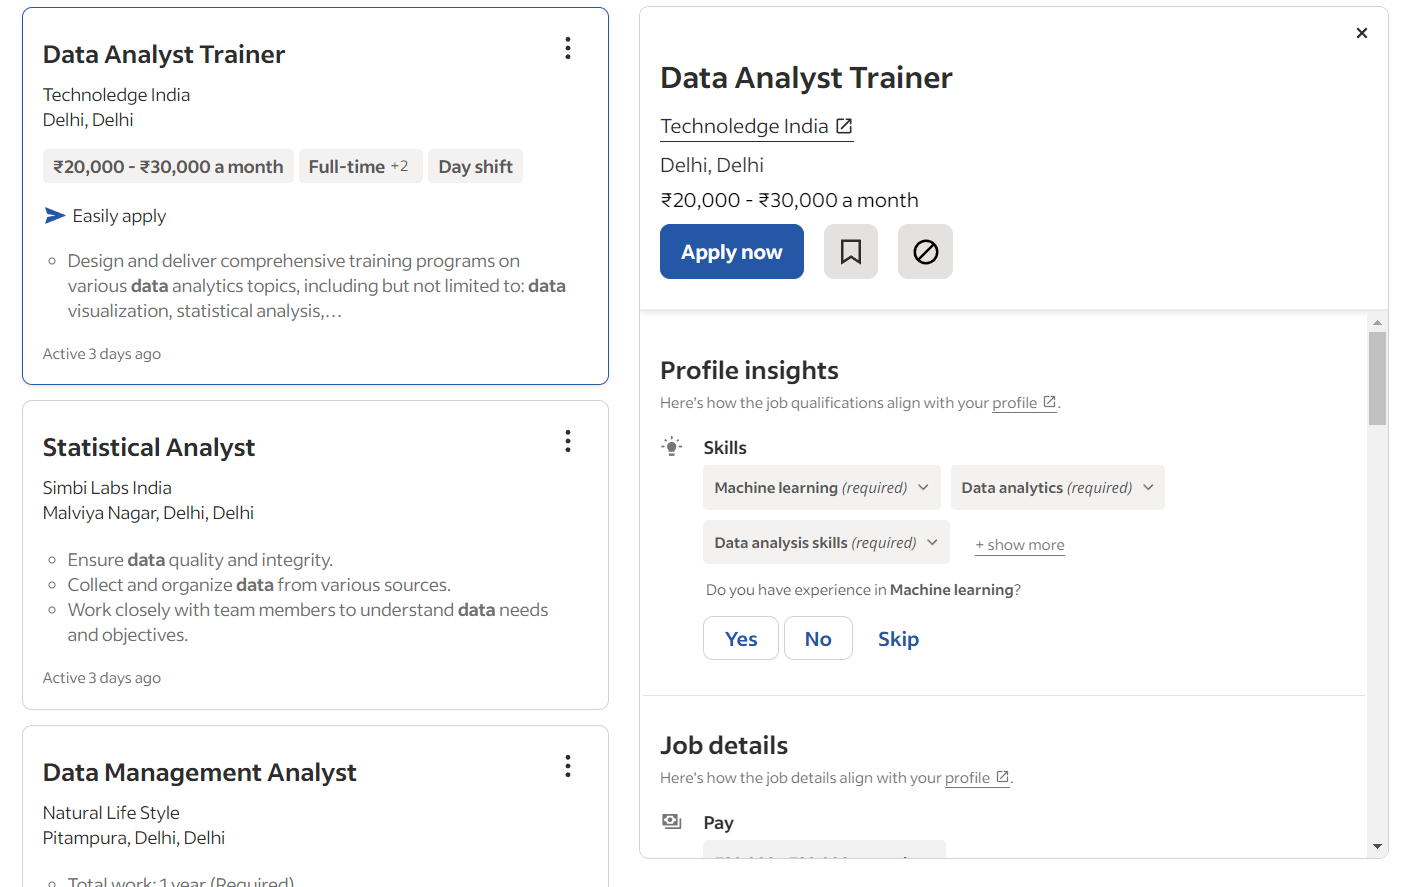
Current Job Openings in Data Analytics in Delhi
In Delhi, the current job opportunities in Data Analytics are abundant, reflecting the city’s growing emphasis on technology and data-driven decision-making. Companies across various sectors, such as IT, finance, and healthcare, are actively seeking skilled professionals for roles such as Data Analyst, Data Scientist, and Machine Learning Engineer.
Embarking on a career in data analytics opens up a realm of opportunities for individuals seeking to navigate the vast landscape of information. In Delhi, the demand for skilled data analysts is steadily growing, making it a prime location to delve into the world of data analytics.
Many aspiring professionals are eager to explore the lucrative prospects that come with mastering data analytics skills, and as they consider enrolling in training programs, the question of the salary for data analytics training in Delhi inevitably arises.
The allure of competitive salaries for data analytics professionals further enhances the appeal of investing in comprehensive training. In Delhi, the prospect of earning a substantial income after completing data analytics training acts as a powerful motivator for individuals looking to chart a successful career path in this dynamic field. The salary for data analytics training in Delhi not only reflects the city’s recognition of the value of data-driven insights but also underscores the financial rewards awaiting those who embark on this transformative journey.
The demand for expertise in extracting insights from data creates diverse opportunities for Data Analytics professionals in Delhi, making it an opportune time for job seekers to explore rewarding and impactful career paths in this dynamic and evolving field. You can refer to websites like Naukri.com, Linkedin.com, Indeed.com, and many more.
Conclusion
Data Analytics courses in Delhi are in demand and trending because the modern era is more inclined towards having an online presence in every aspect of both professional and personal life. This field has successfully placed thousands of aspirants and yet leave behind a large vacancy. It is a high-paying yet classy job of the decade and given it is not a cinch requires specific training and experience to outdo here. So, considering proper data analytics courses in Delhi can help you excel.
FAQs: Data Analytics Course
What sets apart DigiPerform’s data analytics courses from others in the market?
DigiPerform’s data analytics courses stand out in the market because of the unique and distinctive features. Firstly, due to the meticulously crafted curriculum that covers latest and most recent industry trends and technologies. Secondly, the courses also emphasize hands-on practical training and learning that allows participants to apply practical concepts in the real-world scenarios.
Another plus point with Digi Perform is that it integrates projects and case studies that are relevant to the industry, that provides a comprehensive understanding of how data analytics can be applied across different domains. What sets Digi Perform apart from its competitors is the fact that the institute provides enhanced learning that is possible due to the inclusion of experienced and proficient instructors and personalized mentorship.
Why do you need data analytics training?
1. Huge Growth Opportunity: Data Analytics courses in Delhi provide you with a wide range of job prospects and more opportunities. By enrolling in Digi Perform’s Data Analytics course you will gain mastery in all aspects of Data Analytics.
2. Big Salaries on Offer: Digi Perform’s Data Analytics course will instill in you many skills which in turn will help you in getting a job with a handsome salary.
What type of assistance do students enrolled in Digi Perform’s Data Science course receive both during and after the course?
Digi Perform has been dedicated to providing our students with extensive and full assistance. Throughout this program, you will be provided with complete guidance of seasoned and expert mentors with participation in live sessions and there will be an environment which would in turn encourage collaborative learning.
What educational qualifications are needed to start a career as a data analyst in Delhi?
To become a data analyst in Delhi, you typically need a bachelor's degree in statistics, mathematics, computer science, or a related quantitative field. Having relevant skills and internship experience can provide a competitive advantage.
What does a data analyst typically do each day?
A data analyst's daily tasks involve collecting and processing data, analyzing trends using programming and statistical techniques, creating visual representations of data insights through dashboards and reports, and interpreting data to support business decision-making.
What computer languages do data analysts use?
Data analysts often use SQL, Python, and R for tasks such as data manipulation, mining, modeling, analysis, and visualization. Additionally, shell scripting is used to automate various tasks.
How can I grow in my data analyst job?
With experience, data analysts can advance to roles such as senior data analyst, analytics manager, or data scientist. Pursuing further education and gaining specialized skills can accelerate career advancement.
Do you need a special certificate to be a data analyst?
While not required, certifications can showcase your proficiency in tools like Excel, Power BI, and Python. Notable certifications include IBM Data Analyst Professional and Tableau Desktop Certified Associate.
